Explored the trend of big tech companies' M&A for the last two decades, and tried to provide insights for both the startups and the investors
Recreated The New York Times Coronavirus Map with React and d3 framework
An estimate of global and hemispheric surface temperature change from 1880 to 2014

Visualized COVID-19 data from the first several weeks of the outbreak to see at what point this virus became a global pandemic

Visualize the trend of Nobel Prize Winners from 1901 to 2016
Created a visual report for the space commander of aliens who docked at outpost Deep Space 12 yesterday.
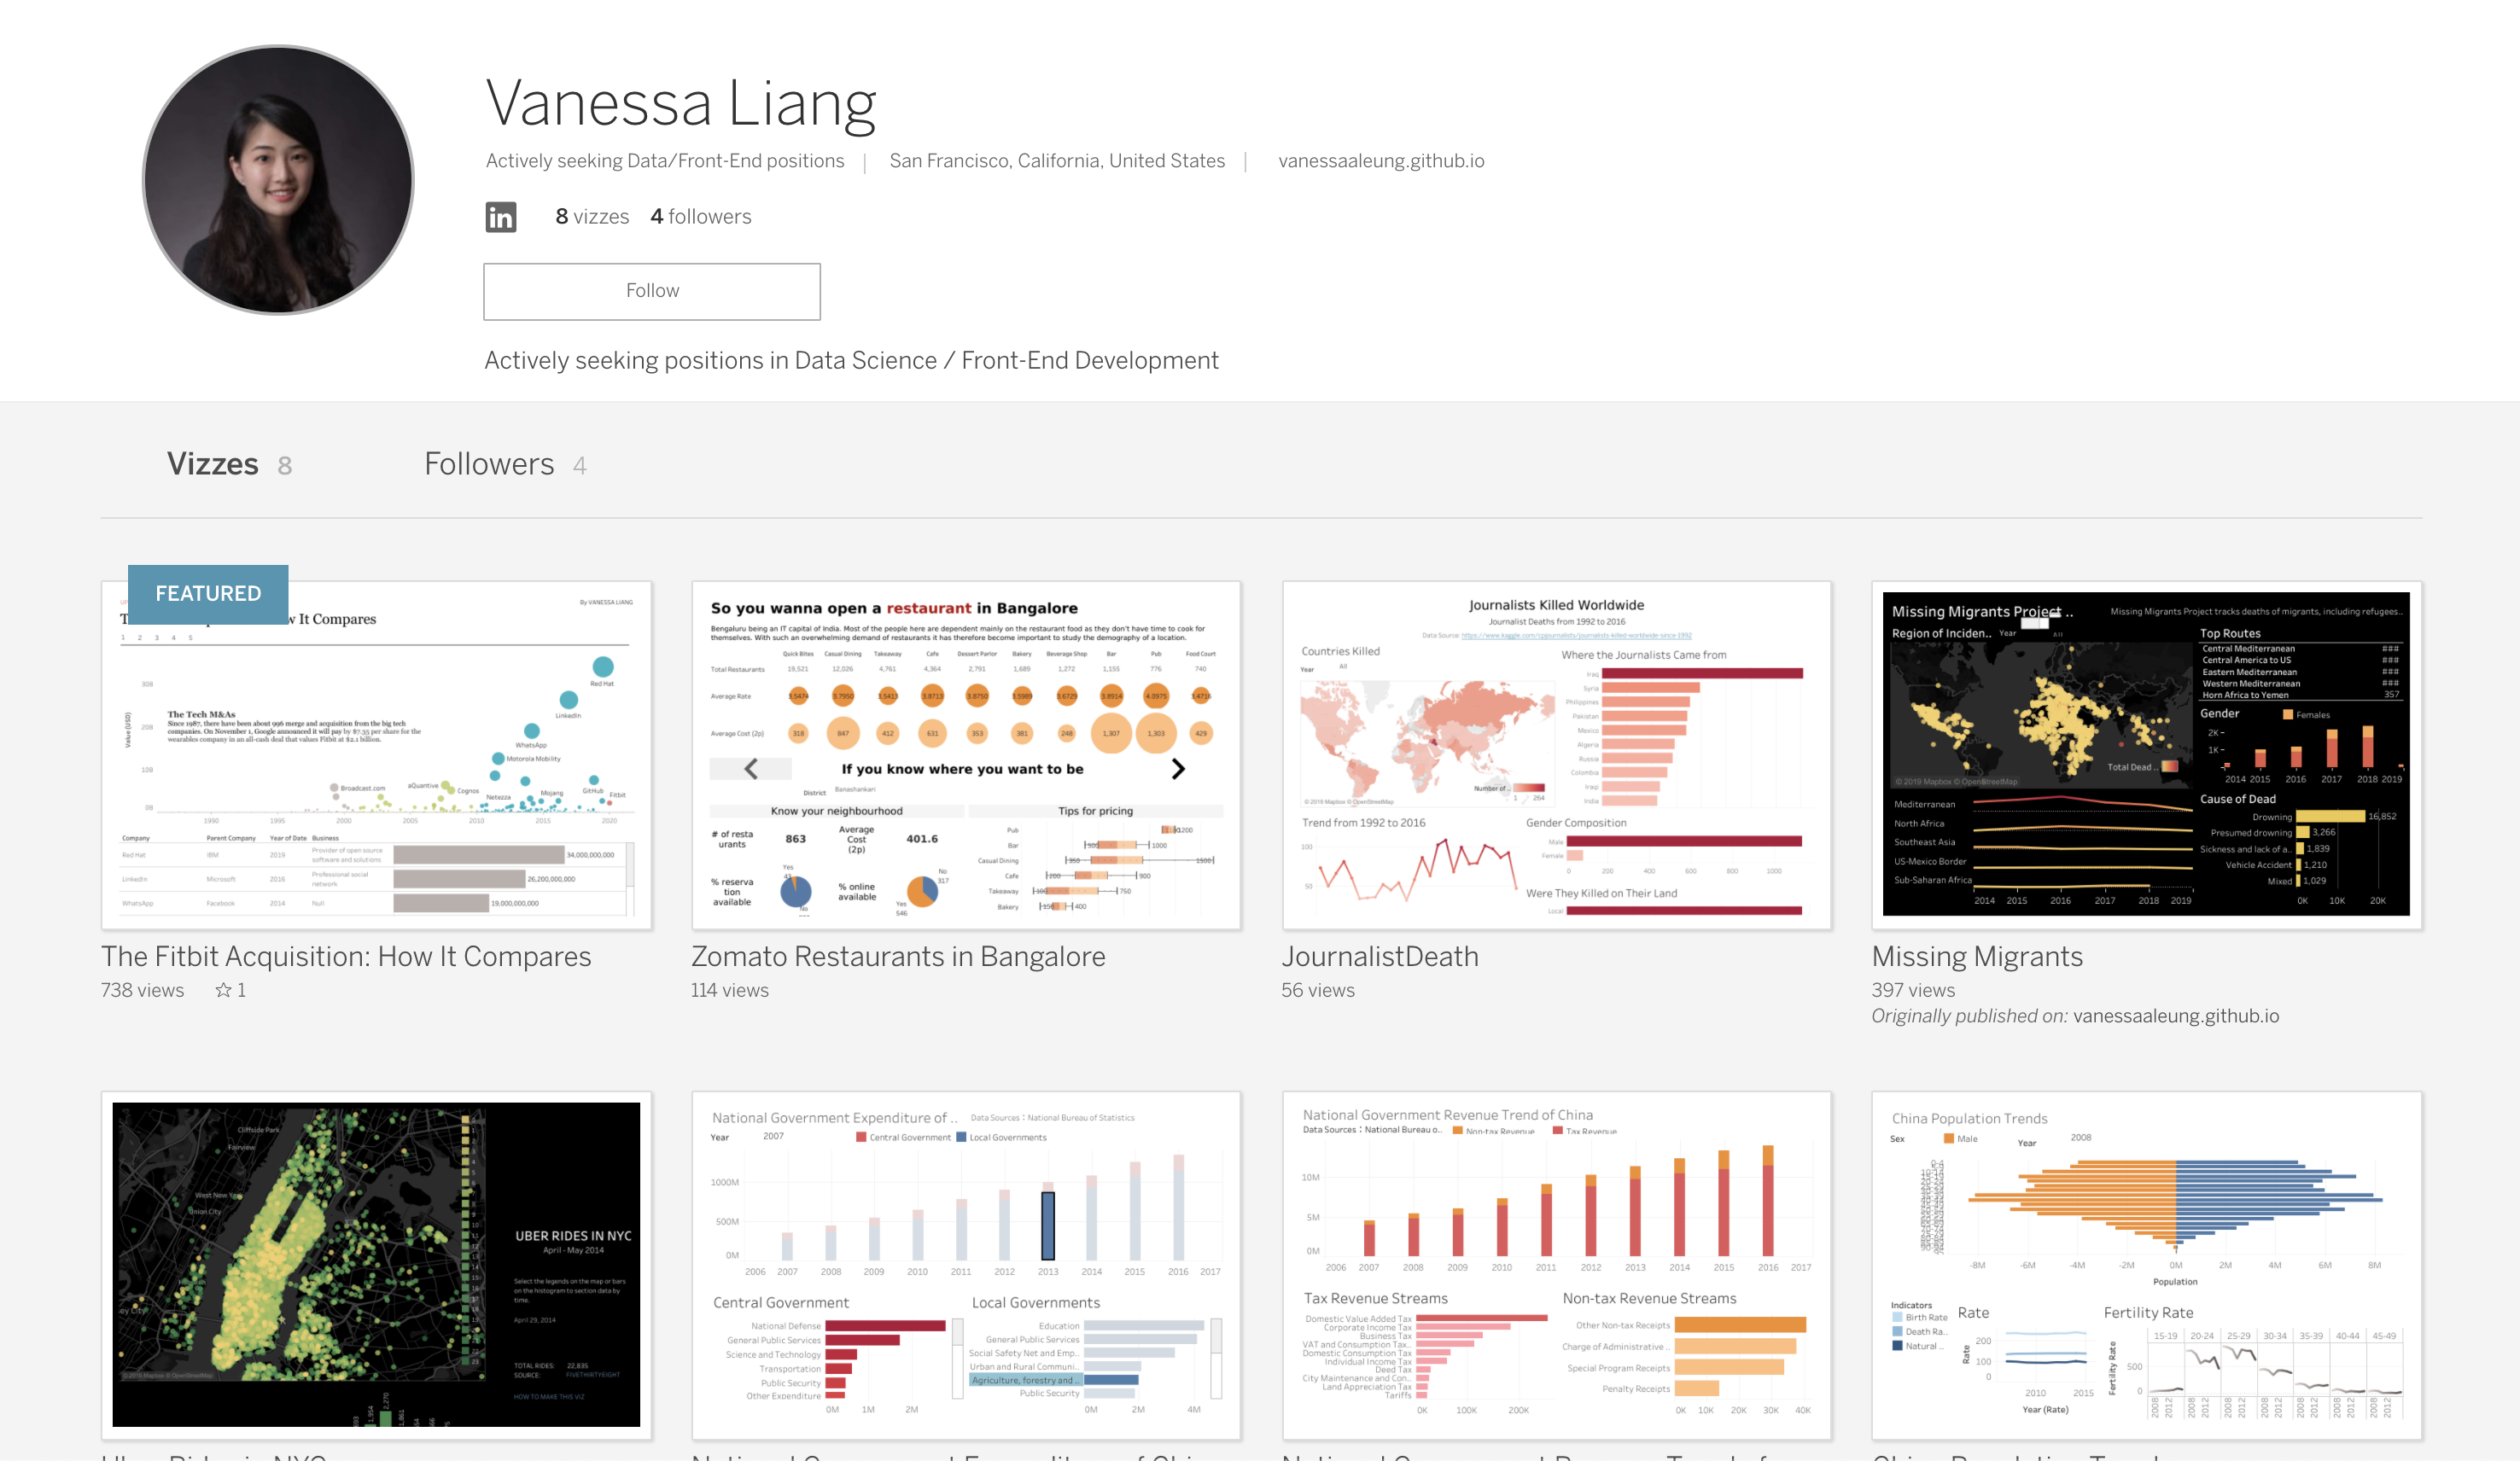
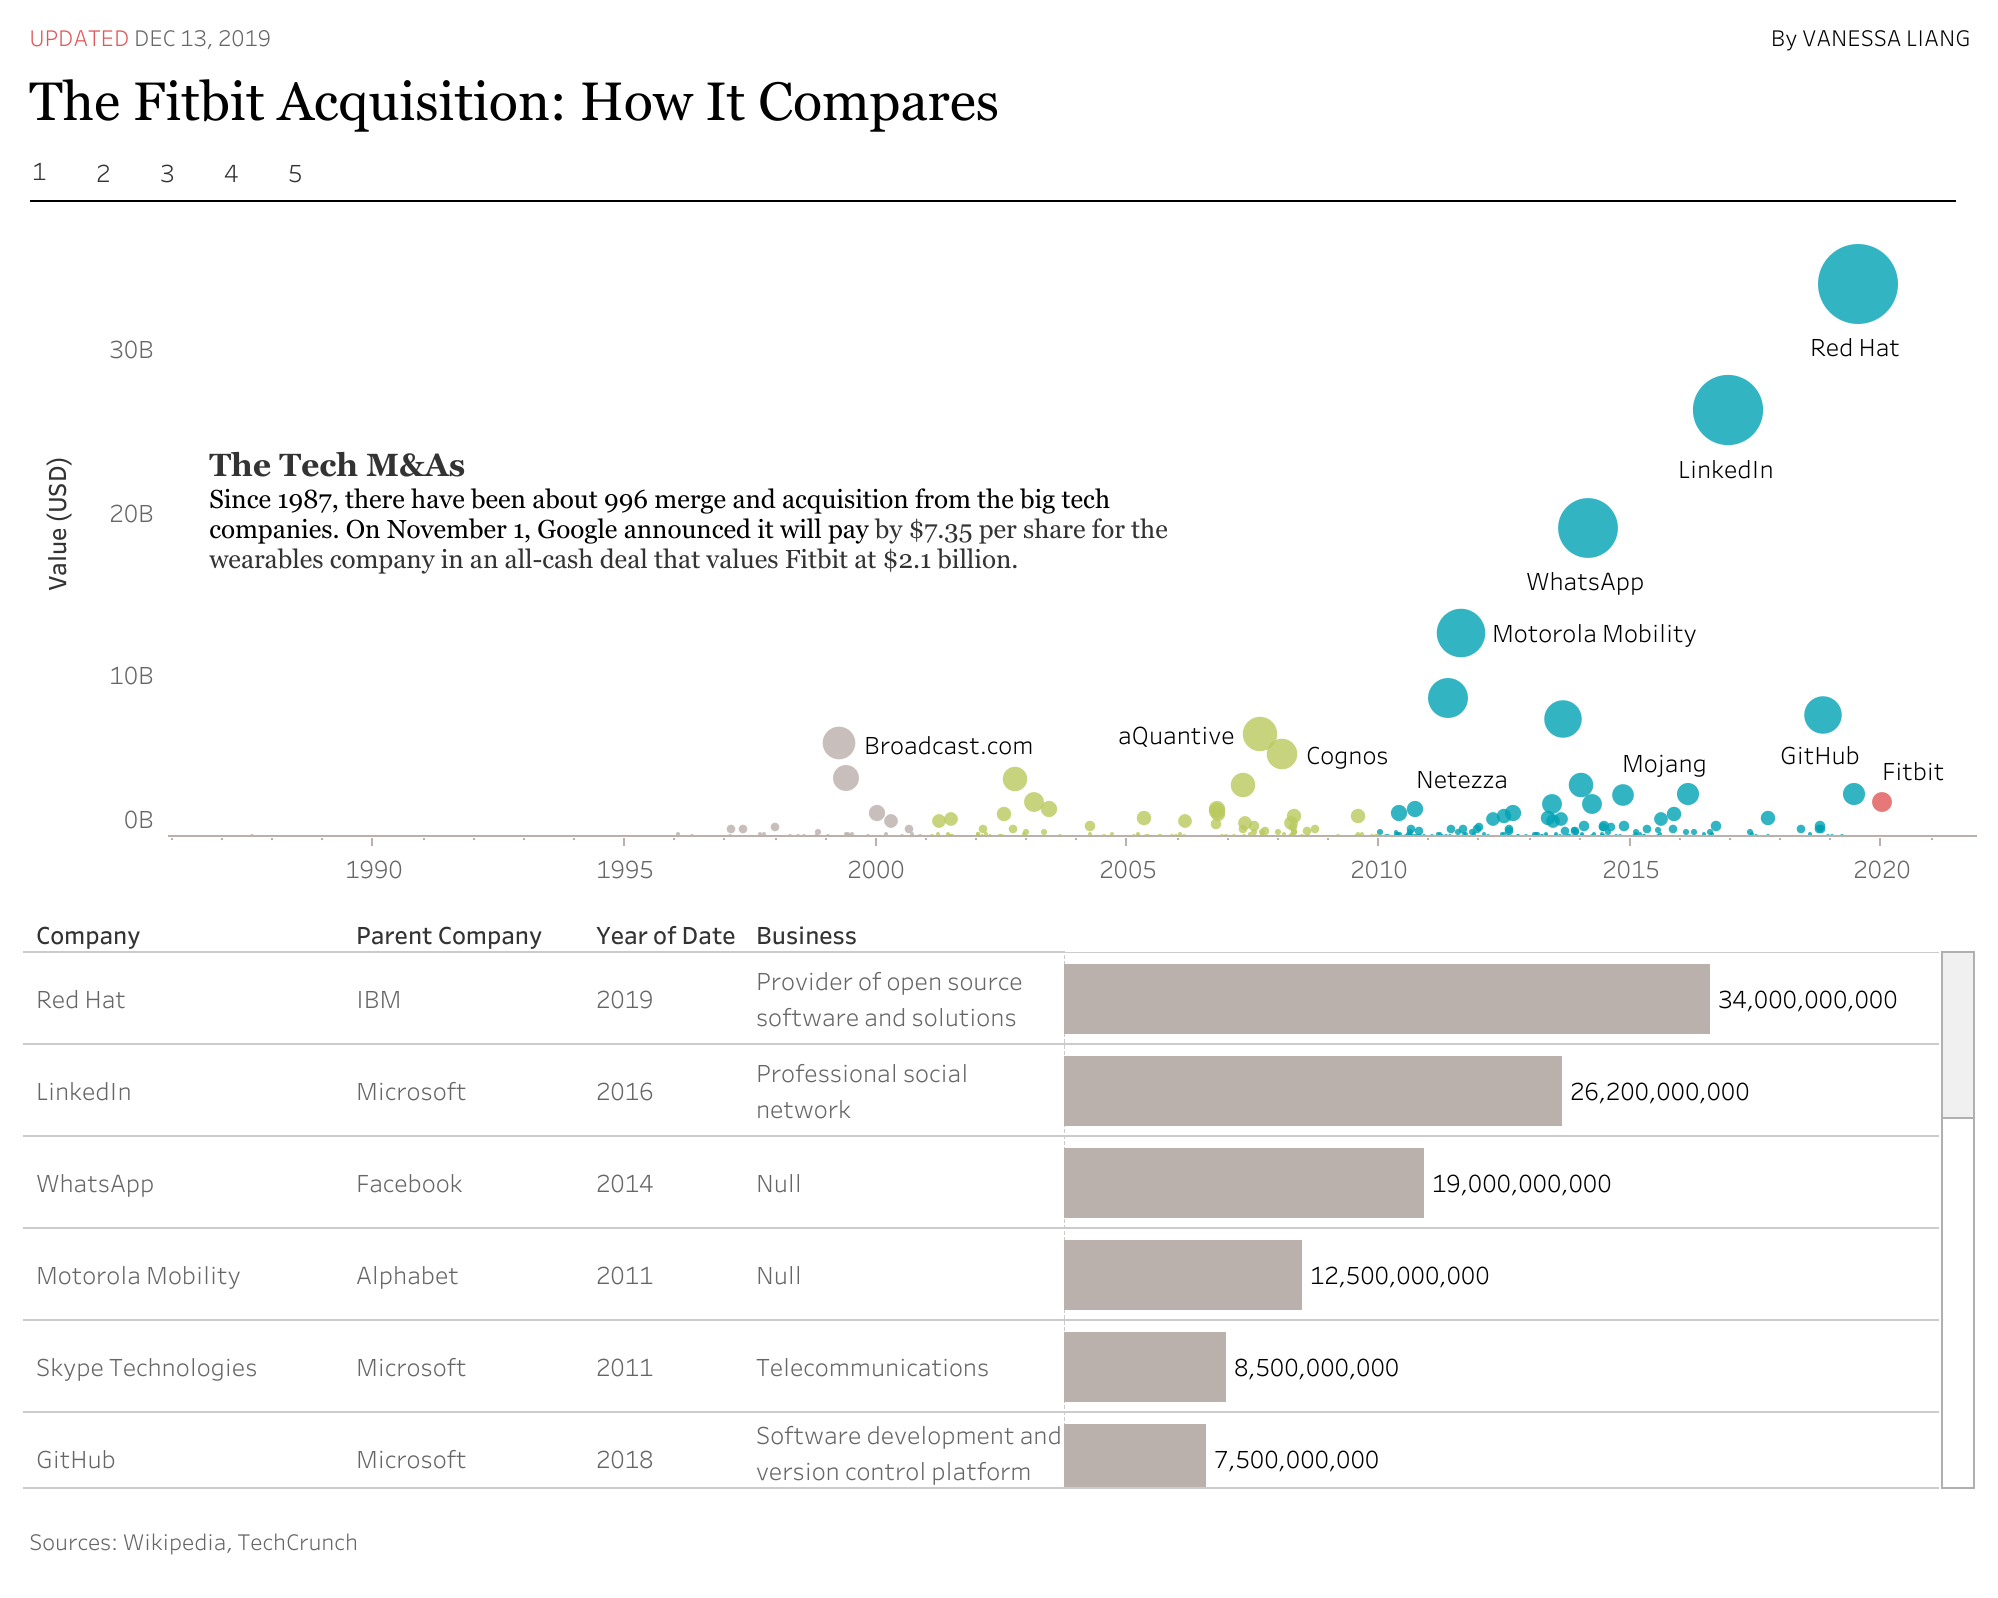
Google will pay $7.35 per share for the wearables company in an all-cash deal that values Fitbit at $2.1 billion. Take a look at the tech giants' acquisitions for the past 30 years.
Missing Migrants Project tracks deaths of migrants, including refugees and asylum-seekers, who have gone missing along mixed migration routes worldwide. #Culture #Economics